
Is a dice fair if each number appears equally often?

Roll your dice and make a statistic.

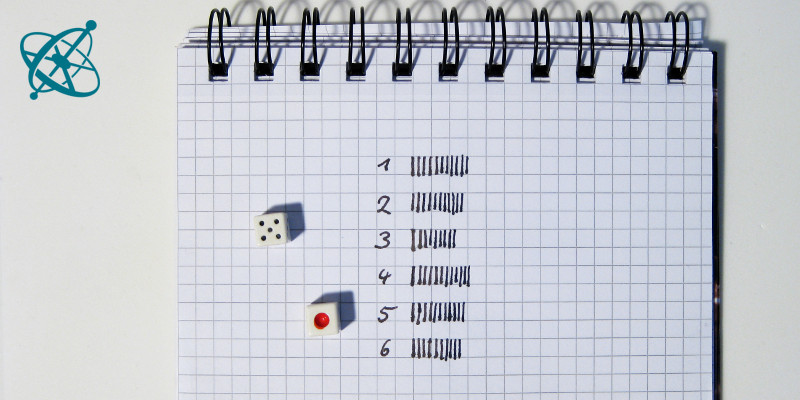
Looks like loaded dice? Roll more dice!

If the dice are loaded or clean,…

…you can only know with a sufficiently large sample size.
 www.sciensation.org | Ciênsação hands-on experiments are published as Open Educational resources under a Creative Commons Attribution-ShareAlike 4.0 International License.
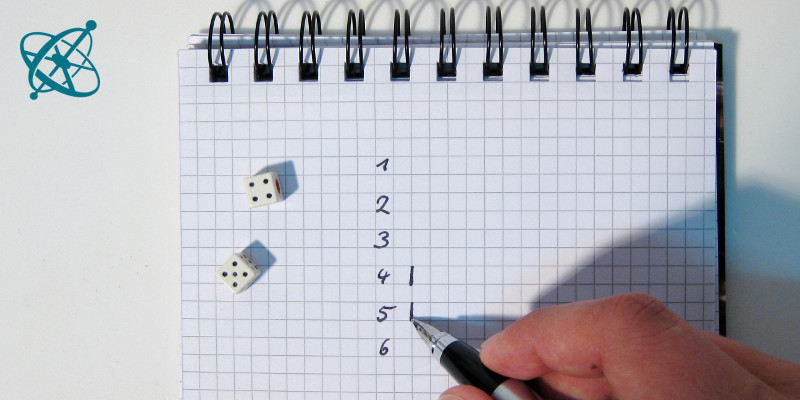
Is a dice fair if each number appears equally often?

Roll your dice and make a statistic.

Looks like loaded dice? Roll more dice!

If the dice are loaded or clean,…
…you can only know with a sufficiently large sample size.
Rolling the dice
Humans have a very bad sense for statistics. Our 'feeling', how likely certain events should be, does not always match the statistical reality. Technology, on the other hand, is increasingly shaped by algorithms that decide based on statistics and probabilities. Since these technologies take important decisions for us, it is crucial to gain at least a basic idea of probability distributions, the importance of sample sizes and how statistical results should and should not be interpreted.
If your time allows, you may want to do this experiment for the triangular probability distribution obtained when each event is the sum of two dice.
Gaining a better feeling for stochastic (meaning random) events, sample sizes and probability distributions.
In this experiment, you repeatedly throw dice and record how often each number appears.
1. Before you start, what do you think the result will look like?
2. How often do you think you need to throw dice before your predicted result can be clearly seen?
3. Throw your dice. Does the outcome match your expectations?
Are all numbers 1 to 6 equally probable?
› Yes.
Does this mean that each number has to appear equally often?
› No, each throw is an independent stochastic event.
Should you conclude the dice are 'loaded' or 'unfair', if after rolling 12 dice not all numbers have appeared twice?
› No, that would be a typical over-interpretation of a statistic with an insufficient sample size.
Why does the result look better, meaning closer to a uniform distribution, the more events you record?
› The discrepancies become smaller relative to the overall result.
Most people expect that with every additional event noted down, the distribution should become more uniform. After a while, the distribution indeed takes a rectangular shape, where each number appears more or less equally often. The often surprising aspect of this experiment – and the main reason to conduct it – is how long it can take for this shape to become clearly visible.
This experience will give your students a better feeling for stochastic processes and help them to understand why reliable statistics require large sample sizes. You could then discuss some examples from medical or social studies with small sample sizes and ask your students to critically interpret how reliable these 'results' are.